After reviewing financial statements from over 1,000 different optometry practices, it’s no surprise to me what owners say about them:
- “I’m just not good at finance stuff.”
- “I reconcile my QuickBooks every month. I know it’s right. I just don’t know what it means.”
- “The checking account balance is going up, so I must be doing okay.”
After all, most Profit & Loss (P&L) Statements start with the basics: Gross Income (Revenue) and Cost of Goods Sold. However, after Gross Profit, Operating Expenses are shoe-horned into an alphabetized list of generic expenses. Essentially, two-thirds of a practice’s expenses have no intentional organization.
Many practices don’t separate owner pay from regular staff wages, or OD compensation from non-OD team members. That leaves owners unclear about how much they’re earning or spending.
How Should I Organize My Practice Expenses?
At Books & Benchmarks, we always start by migrating all our clients’ financials to our chart of accounts in QuickBooks Online. It helps clarify overhead and simplify analysis by categorizing expenses into 7 Key Expense Areas:
- Cost of Goods Sold (COGS)
- Non-OD Staff Compensation
- Occupancy Costs
- Equipment Costs
- Marketing Expenses
- General & Administrative Expenses
- OD Compensation
What’s a “Good” Benchmark for Overhead Costs?
But even after reducing a generic P&L from, let’s say, thirty-six operating expense line items to seven, it can still be challenging to assess how you’re performing. For example, in 2023, the middle 60% of practices spent between 24%–32% of revenues on COGS. That same group spent between 20%–27% on non-OD staff compensation.
It’s hard to say which is the right number:
- 24% or 32% for COGS?
- 20% or 27% for staff?
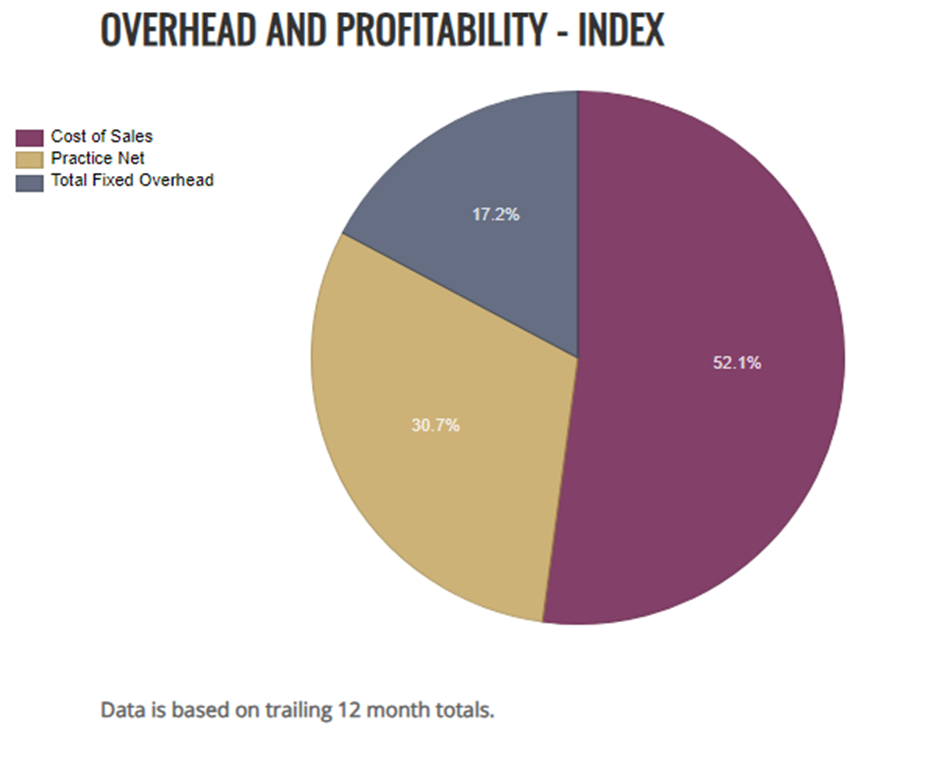
Even though we can reduce the loss portion of a Profit & Loss Statement to 7 Key Expense Areas, we believe those expense areas derive from three more integral categories: Variable Costs, Fixed Costs, and Practice Net (also known as Optometric Net).
Our Very Favorite Pie Chart
To quickly define those terms:
- Variable Costs (we also call them Cost of Sales) are the expenses that increase as a practice sees more patients: Cost of Goods Sold and non-OD Staff.
- Fixed Costs are the expenses a practice incurs regardless of how many patients it sees: Occupancy Costs, Equipment Costs, Marketing Expenses, and General & Administrative Expenses.
- Practice Net includes the pay and benefits for all the doctors, plus the operating income of the practice. For more on how a practice can measure profitability, read our blog posts Understanding Benchmarks: Profitability Part 1 and Part 2.
Here’s how those three buckets lay out, on average:
What’s a Healthy Balance Between Variable and Fixed Costs?
Historically, Variable Costs were less than 50% of revenues, Fixed Costs were about 20% of revenues, and a good target for Practice Net was 30% or more.
However, post-inflation, things have shifted. In our most recent Cost of Sales Benchmark, the middle 60% of practices now spend 47%–56% of revenues on COGS and non-OD Staff combined. This is surprising, and it’s also one of the reasons why we created Books & Benchmarks. We wanted to understand current trends in overhead and profitability.
Another interesting point is that fixed overhead is a bit lower than we predicted. This is likely a result of the size of our client practices. With a median practice size of $1.55MM in revenue, we see the impact of generating high revenue while keeping fixed expenses at a moderate level. This leads to increased profitability as practices grow.
Why Do Some Practices Have Higher COGS While Others Spend More on Staff?
Cost of Goods Sold and Non-OD Staff tend to be related. It comes down to your practice model:
- Medical-heavy practices typically show lower COGS but higher staff costs to support more patient flow
- Optical-heavy practices tend to have higher COGS but lower staff costs
This correlation is key to understanding how your spending reflects your business priorities.
Let Books & Benchmarks Help You Simplify
If you’re looking to get your arms around your financials, don’t go do something, sit where you are! Let our professional bookkeepers take over categorizing and reconciling your QuickBooks file every month. Our optometry practice benchmarks engine will automatically create the insights you need to understand and advance your practice. Schedule a call with our experts today!
c")