Optometry Practice Financial Benchmarks
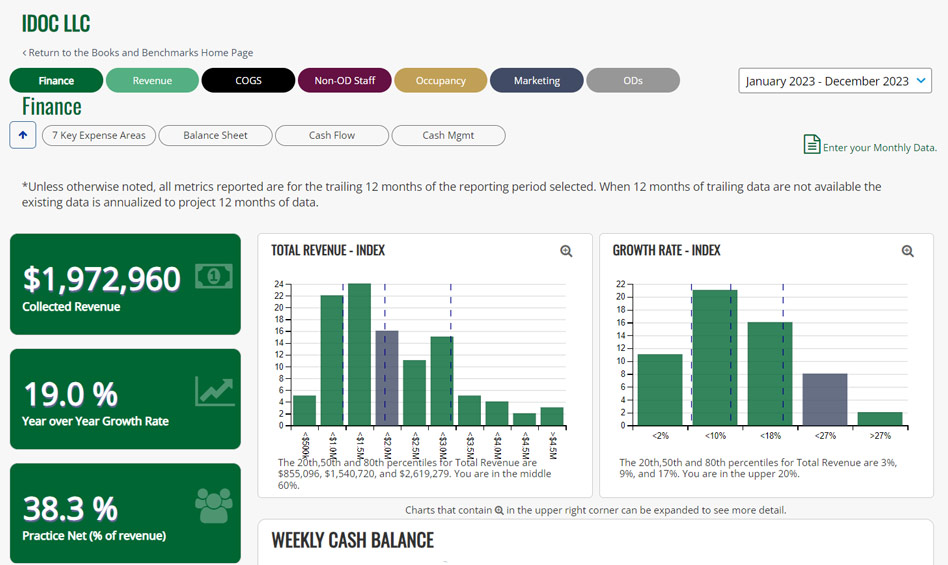
“How am I doing?” is a question that is constantly on a business owner’s mind. The Benchmarks Report is a valuable tool designed to help you understand how you compare to other optometry practices and—more importantly—how your practice is changing over time.

Benchmarks for Optometry Practices
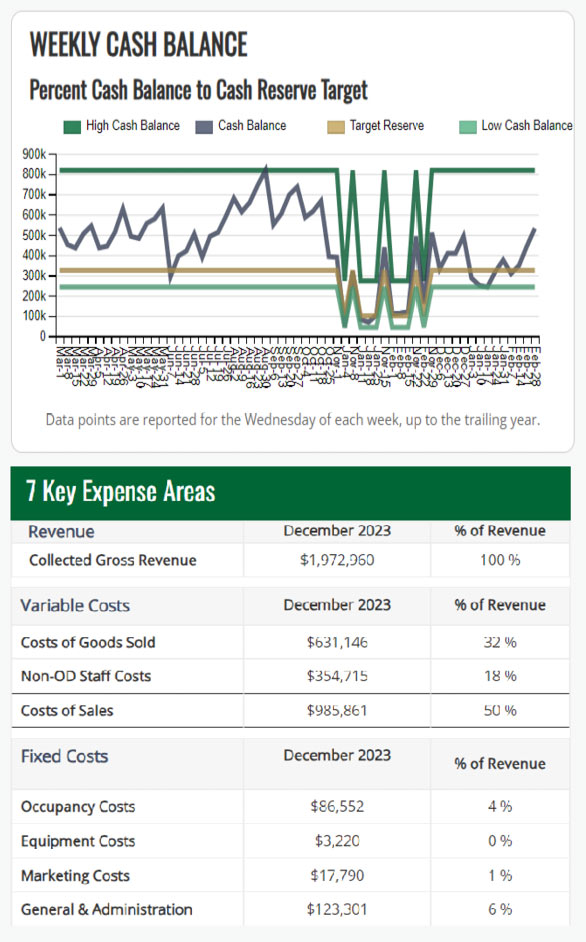
Comparing your financial and productivity data with other optometry practices can provide valuable insights, leading to informed decision-making and strategic planning.

Automated & Trustworthy
We know you’re busy. That’s why we automatically generate our benchmarks using your practice’s existing records. We’ll take care of pulling financial information from QuickBooks Online and preparing it for you. We’ll also gather your non-OD staff hours and exam counts. All we’ll need from you each month are your ODs’ work hours and your practice’s available exam slots.

Financials, Simplified


Productivity Benchmarks Explain Overhead
If one of your expenses is higher than usual, you might be wondering why. Our productivity benchmarks go beyond the numbers to help you understand the reasons behind your spending. For example, if your occupancy costs seem higher than other practices, it could be because you have more space than you need or you’re paying more per square foot. These benchmarks can also uncover growth opportunities, giving you the confidence to invest more in your practice to drive future revenue and growth.
Bookkeeping
Payroll Support
Financial Partners

Books & Benchmarks Resources
Welcome to your go-to resource for tips on growing your business and gaining a deeper understanding of your practice’s performance. In our blog, you’ll find valuable insights on topics such as managing your practice more efficiently, assessing your financial position in the eye care industry, and making smarter decisions for your business.

