Last week, we talked about different ways to measure optometry practice profitability using metrics found on a practice’s income statement or P&L. This week, we’ll take a second look at Net Operating Income, which on our chart of accounts is also a calculation of EBITDA, and discuss what EBITDA means. We will then cover why we use a metric called Practice Net Income or Optometric Net to benchmark profitability.
Net Operating Income
As we shared last week, Books & Benchmarks intentionally uses different financial layouts for the QuickBooks files we keep for our clients and the Financial Benchmark Report we generate in our member portal. Side-by-side, here’s how they are different:
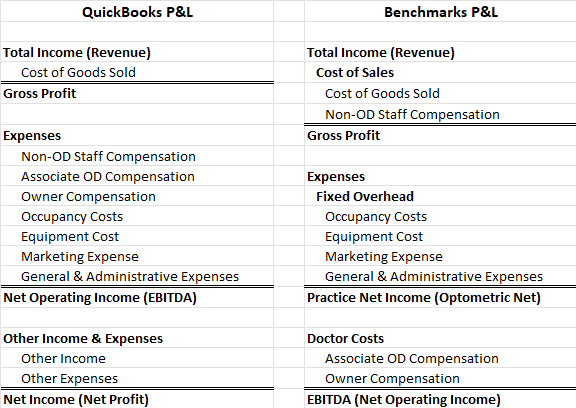
Picking up where we left off, the Net Operating Income (also called Ordinary Income) in the QuickBooks statement is the bottom line of our optometry financial benchmarks. We focus on this because unrelated or unusual revenue and expenses (Other Income & Expenses on the P&L) aren’t pertinent to understanding the business’s performance. Our Net Operating Income is also a measure of EBITDA, so let’s start there as we discuss how Books & Benchmarks looks at profitability.
What is EBITDA?
EBITDA stands for Earnings Before Interest, Tax, Depreciation, and Amortization. It’s the income a practice would generate if it didn’t have any debt or deductions related to capital expenditures. Its most common use is in business valuation because, in an asset sale (as opposed to a stock sale), a seller is responsible for repaying any outstanding debt. EBITDA, therefore, is the income a buyer can expect to receive.
EBITDA is a useful metric and a common talking point with all the private equity acquisitions over the past five years. That’s why we define Net Operating Income as EBITDA, but it’s important to note that it’s not a perfect measure.
Many owners set their salary significantly higher or lower than what it would cost to replace their patient care and management time. As a result, benchmarking EBITDA as a percent of revenue doesn’t mean much without normalizing adjustments to the owner’s salary.
Why EBITDA Alone Doesn’t Tell the Full Story
Consider the following histograms of EBITDA and doctor pay for our Books & Benchmarks practices (x-axis labels are the midpoints of a range; y-axis is the number of practices that fall in the range):
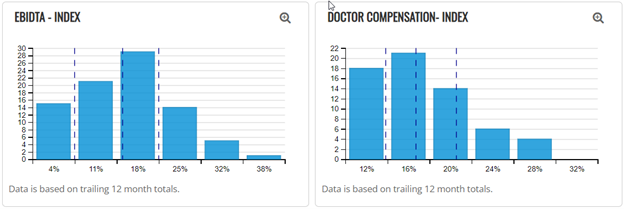
The range for EBITDA and doctor compensation spans roughly 0% to 30%. In practices where doctor pay is over 20%, it usually means an owner is taking an above-market wage, and EBITDA is correspondingly lower. Where doctor pay is lower, that often means the owner is taking a below-market salary (or no salary at all), so EBITDA appears higher.
And that’s without even factoring in elective expenses that are legitimate business expenses but wouldn’t apply to a future owner. For example:
- Some pay above- or below-market rent to themselves for buildings they own.
- One practice buys season tickets to a local sports arena as a staff benefit.
- Many spend tens of thousands bringing their teams to industry events like the upcoming IDOC Connection.
So while raw EBITDA is useful, it’s not a perfect way to benchmark performance. Adjustments to owner compensation and elective expenses are standard practice when valuing a business. And since owner salary adjustments can exceed $100,000, we rely instead on a metric that controls for owner wages.
What is Practice Net Income?
The best way we know to benchmark profit is a metric that makes apples-to-apples comparisons between:
- Single-doctor and multi-doctor practices
- All-partner practices and practices with a mix of owners and associates
- Practices where owners pay themselves a lot or a little
To do this, we combine the pay for all the ODs in the practice with EBITDA. This helps answer the hypothetical: if all practices only had owners, how much of the revenue would go to those owners, regardless of their mix of salary and profit?
And that’s Practice Net. It’s a useful and the best way of comparing the salary and profits available to doctors in an optometry practice.
What Does Practice Net Look Like?
Here’s a chart showing what Practice Net looks like for our practices:

It still has a wide distribution (with new, small practices at the low end and large, high-profit rural practices at the high end), but most practices cluster between 25% and 35% of revenue.
Of course, like any metric, Practice Net has its limits. For example, it can be misleading if a practice is inefficient with its associates. And if there’s debt in the business, none of these profit metrics will fully reflect how much income an owner can take home.
In conclusion
To wrap up, different measures of profit each have their uses. Net Income on the P&L should generally be understood as the number driving an owner’s tax liability. Net Operating Income or EBITDA, especially adjusted EBITDA, is the essential number when valuing a business in an asset sale. If you want to assess how your profitability compares to your peers, Practice Net is your number.
If you want to learn more about our approach to helping independent optometry practice owners understand their businesses and make better decisions, schedule a call with our experts today!
c")